The short answer: if you need a 2TB system or game drive within the next 90 days, buy it; do not postpone a useful upgrade for a price decline that has not begun, but do not let shortage headlines push you into paying for PCIe 5.0 either. In a same-store Taiwan sample on 12 August 2026, the gap between 2TB QLC and TLC drives was NT$900. QLC is a defensible budget trade for ordinary games and home use. TLC is the better place to spend that NT$900 for sustained writes, virtual machines or a work drive. Bulk cold data still belongs on an HDD, while used enterprise U.2 is only for buyers prepared to inspect drive health and solve adapter, boot and cooling issues.
That recommendation does not rely on the viral claim that “average NVMe prices rose 115%.” There is no reproducible basket of models, retailers, dates or starting prices behind it. Treating the upstream quote for one NAND die as the retail increase for a complete SSD also compares two different products. What can be checked is more precise: on 31 March, TrendForce forecast a 70–75% quarter-on-quarter rise in 2Q26 NAND Flash contract prices; on 21 July it estimated a roughly 4–5% NAND supply deficit for 2026 and expected constraints to begin easing in the second half of 2027. Those are still research forecasts, not an observed average transaction price at Taiwanese stores.
Four circulating numbers, and why only one survives with caveats
| Circulating claim | What the source check found | How this article treats it |
|---|---|---|
| Average NVMe prices rose 115% | No reproducible product basket or baseline | Dropped; it is not used to forecast Taiwan retail prices |
| 1Tb TLC NAND rose from US$4.80 to US$10.70 | Phison chairman K.S. Pua described one quote from one unnamed supplier at about 23:16 in the company’s 7 November 2025 online investor meeting; the arithmetic is +122.9%, not 115%, and a 1Tb die is not a 1TB SSD | Retained only as a named supplier anecdote, never a market average |
| NAND is 90% of SSD cost | No verifiable Phison or manufacturer bill of materials supports a fixed percentage; capacity, controller, DRAM, PCB, firmware and warranty change the mix | The fixed percentage is dropped |
| All 2026 NAND is sold out | At about 27:40 in the same meeting, Pua said every supplier had told Phison so; that is management reporting an allocation condition, not an audit of every producer, and it does not mean zero retail stock | Rewritten as “upstream allocation is tight and some volume is committed” |
There is a unit trap as well: 1Tb is one terabit, while 1TB is one terabyte—an eightfold difference. A finished SSD combines multiple NAND packages with a controller, power circuitry, a PCB, and sometimes DRAM. An upstream die quote cannot simply be multiplied into a justified retail increase.
Why supply is tight: NAND wafers are not being turned into HBM
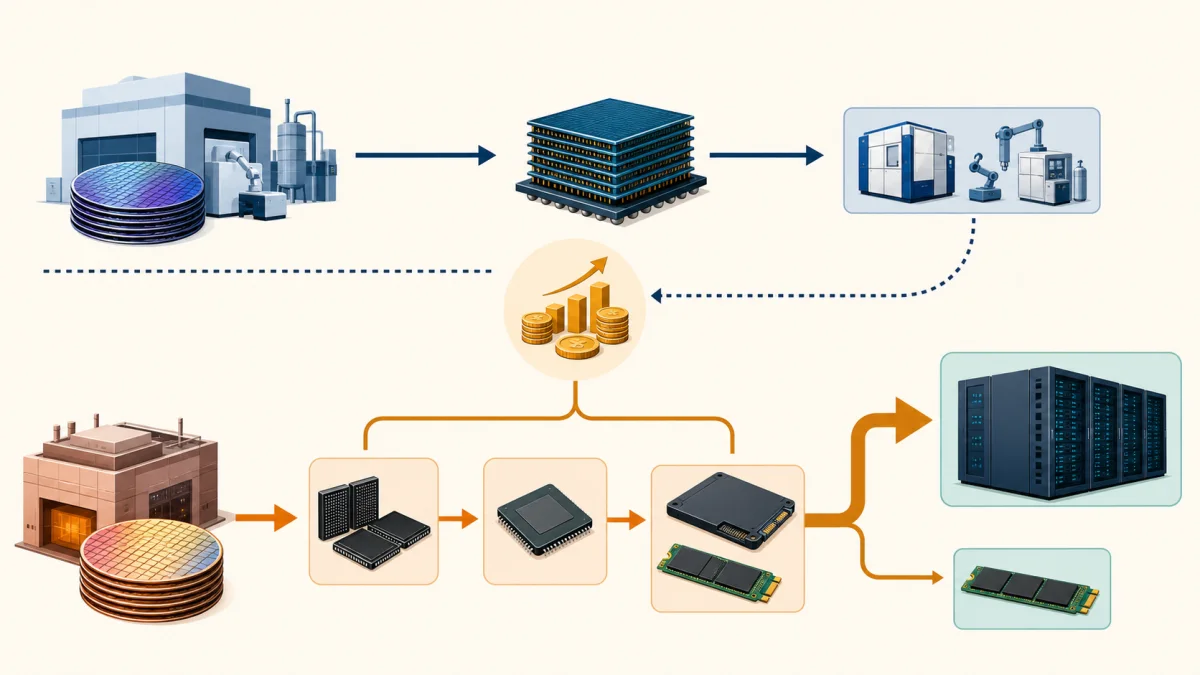
The squeeze has three layers that should not be collapsed into one story.
The first is the after-effect of 2025 production cuts. NAND began 2025 with excess inventory and weak demand. Manufacturers reduced utilization and delayed some transitions. When AI-server and enterprise-SSD orders strengthened later in the year, supply and bit output could not ramp fast enough within one quarter to catch demand: wafer cycle time, yield and product-allocation changes all introduce a lag. Installed wafer capacity did not literally disappear during the cuts.
The second is enterprise SSDs moving up the allocation queue. TrendForce’s second-quarter outlook said suppliers were directing more NAND toward enterprise SSDs while consumer products were scaled back. Micron’s June 2026 earnings material added 16 strategic customer agreements spanning data-center, consumer and automotive customers. Together they cover roughly one-third of NAND volume across the full 2026–2030 period—not a fixed third every year, and not enterprise SSDs alone. It is reasonable to infer that such agreements commit some upstream bits; they do not prove that a finished drive is unavailable at a Taiwanese retailer today.
Only the third layer is HBM’s indirect effect. HBM is a form of DRAM. Drawing a one-for-one arrow from a NAND line to HBM is wrong. The real connection is how a memory company divides capital, engineering, equipment purchases and management attention. TrendForce’s 2026 capital-spending outlook projected DRAM investment up 14% but NAND investment up only 5%, with NAND spending focused mainly on layer count and process transitions rather than large additions of wafer capacity. AI systems also consume enterprise SSDs, so NAND is caught between stronger demand and a lower rank in investment allocation.
Phison is often misidentified in this chain as a NAND manufacturer. Its central roles are controller IC design, firmware and storage-module integration. The controller determines how NAND is scheduled, corrected, mapped and presented to the host, but it cannot create NAND bits. In Phison’s June-results announcement published on 8 July 2026, Pua said supply remained tight with no clear sign of easing and that visibility for some projects reached into the first half of 2027. The same release said price-driven retail storage was no longer strategic and that retail products’ share of revenue was expected to decline over time to below 5%. That second statement establishes a shift in Phison’s own product and revenue mix; by itself it cannot prove that NAND manufacturers changed allocation priority. The first statement does not mean the consumer channel has no drives.
“No new capacity until 2028” is only valid for a named fab
Node migrations, more 3D layers, a shift from TLC to QLC and expansions inside existing fabs can all increase bit supply before a greenfield fab opens. Kioxia and Sandisk announced in July 2026 that Kitakami Fab2 had begun producing their tenth-generation 3D flash. The literal claim that no additional supply can arrive before 2027 is therefore false.
What is demonstrably slow is a major new wafer fab. Micron broke ground in January 2026 on a facility inside its existing Singapore NAND manufacturing complex and gave the second half of 2028 as the start of wafer output. That date belongs to this Micron facility; it is not a master switch for the entire industry. The careful conclusion is that 2026 bit output can still rise through nodes, layers, QLC and existing-fab work. TrendForce expects the broader imbalance to start easing in 2H27, whereas Micron expects tightness beyond 2027; those are not a single consensus timeline.
Taiwan price snapshot: what does QLC actually save?
To keep brand, retailer and interface differences out of the comparison, the sample below uses one brand, ZHITAI; one Taiwanese retailer, Sinya; and two M.2 PCIe 4.0 families. Each page showed a quantity field, add-to-cart and immediate-checkout controls, so the status is recorded as “orderable.” The retailer did not publish an exact inventory count. These are advertised online prices, not market averages, completed transaction data or final delivered checkout totals.
| NAND / family | 1TB | 2TB | 4TB | Published endurance |
|---|---|---|---|---|
| QLC / Ti600 | NT$4,899 (~US$152) | NT$7,999 (~US$248) | NT$14,999 (~US$465) | 400 / 800 / 1,600 TBW |
| TLC / TiPlus7100s | NT$5,199 (~US$161) | NT$8,899 (~US$276) | NT$15,999 (~US$496) | 600 / 1,200 / 2,400 TBW |
Snapshot: 12 August 2026, 14:28 Taipei time. USD estimates use the Central Bank of the Republic of China’s latest published interbank closing rate, NT$32.278 per US dollar on 11 August; retail and card rates differ. NAND type and TBW come from YMTC’s official Ti600 and TiPlus7100s specifications.
These six advertised prices answer a narrow but useful question. The TLC premium over same-capacity QLC is NT$300/6.1% at 1TB, NT$900/11.3% at 2TB, and NT$1,000/6.7% at 4TB. Capacity discounts are visible too: the Ti600 falls from NT$4,899 per TB at 1TB to about NT$3,750 per TB at 4TB. That is a capacity curve inside six related listings, not the average Taiwanese SSD market.
For a 2TB buyer, NT$900 purchases 50% more published endurance—800 to 1,200 TBW—and a higher rated write speed. If the drive holds games, web data and ordinary documents, 800 TBW is not a specification that expires after a few months. Spread evenly across five years, 800 TBW is about 438GB per day, so “hundreds of gigabytes per day” alone is not a QLC/TLC boundary. VM, editing-cache and database users should be buying sustained-write consistency, latency behavior and additional endurance margin—not treating TBW as a countdown timer. At 4TB the TLC premium is only 6.7%, which makes QLC’s saving less compelling unless NT$1,000 is a firm budget ceiling.
Three ways to save, not three interchangeable products
| Option | Quantitative reference | Best for | Cost and pre-purchase checks |
|---|---|---|---|
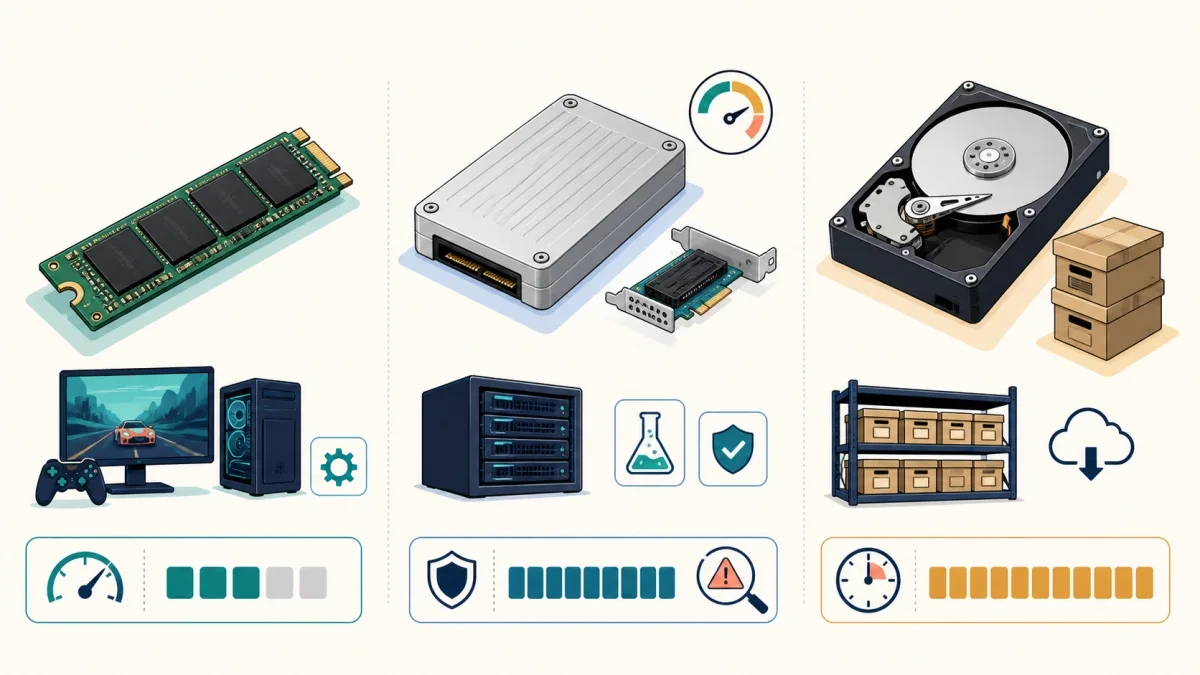
| 2TB consumer QLC | Local sample NT$7,999, 800 TBW, rated 7,000/6,000 MB/s | Games, ordinary home use, read-heavy workloads | Sustained speed can collapse after cache is exhausted; avoid keeping the drive nearly full, with the exact free-space margin depending on model and workload; verify five-year/TBW warranty terms |
| Used 1.9TB enterprise U.2 | Samsung 983 DCT new-drive rating: 3,400/2,200 MB/s, 2,733 TBW warranty-endurance rating, about 8.7/10.6W active read/write | VMs, databases, lab systems, consistent heavy writes | 2,733 TBW is neither a physical failure threshold nor remaining used life; inspect SMART percentage used, data units written, media errors, critical warning, unsafe shutdowns and power-on hours; confirm U.2 adapter, PCIe x4, 12V, boot and cooling compatibility |
| 4TB CMR HDD | WD Red Plus specification around 180 MB/s, 180TB/year workload rate and three-year warranty | Photos, video, installers and backup layers | Poor as a system drive or for frequently launched games; workload rate counts annual reads plus writes and is not comparable to SSD TBW; RAID is not a backup |
Used enterprise storage creates a tempting but unsafe shortcut: “its endurance rating is huge, therefore it must beat a new QLC drive.” The 2,733 TBW figure is the endurance rating/threshold in the product’s five-year limited warranty, not a physical failure point, and “2,733 minus terabytes already written” is not a life countdown. Used-drive risk also depends on percentage used, errors, power-on hours and operating history. Whether any warranty transfers to a second owner is a separate question. If a seller will not provide complete raw SMART data and a return window, treat the device as an unpriced consumable, not a discounted new SSD.
An HDD should not replace every SSD either. Its advantage is low-cost capacity accessed infrequently. Keep the operating system, working set and current games on an SSD; move completed recordings, original photos, offline installers and a second backup copy to a CMR hard drive.
A Gen5 benchmark lead does not mean games load twice as fast
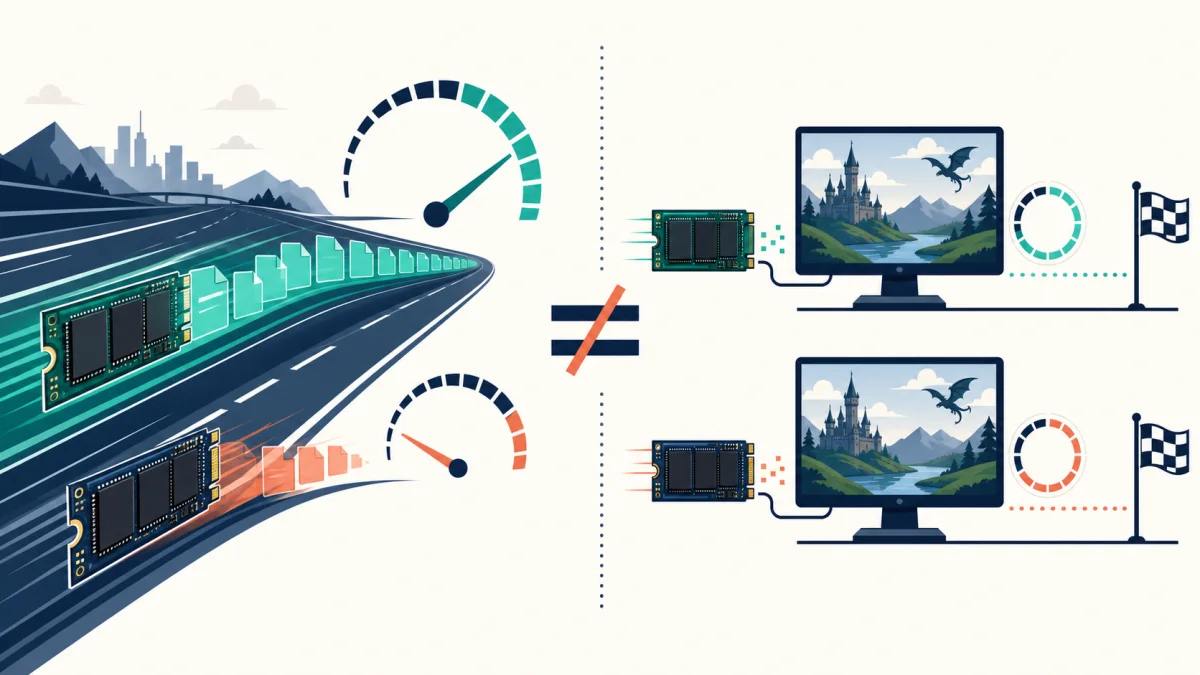
ComputerBase’s 2023 Forspoken 1.12/DirectStorage test summed seven scene transitions and averaged three runs. A 2TB PCIe 5.0 TLC Crucial T700 completed them in 11.1 seconds; a 2TB PCIe 4.0 QLC Corsair MP600 Core XT took 11.3 seconds, a 0.2-second or 1.8% gap. On the same page, measured CrystalDiskMark sequential reads were 12,417 versus 5,067 MB/s, making the former 2.45 times as fast. One game on one platform cannot establish that every game behaves this way, but it is enough to disprove the assumption that a 2.45-times lead in this sequential test produces 2.45-times loading performance.
QLC’s weakness appeared in a different workload. With the drives 80% full, the same review copied a 195GB Steam folder within each SSD. The T700 managed 1,354 MB/s; that QLC model fell to 118.9 MB/s. This single result cannot represent every QLC implementation either. It identifies the stress case buyers should ask about: long writes, large transfers and a nearly full drive. For a games-only machine, moving budget from Gen5 TLC to a larger Gen4 drive is often more useful. A buyer exporting large media projects, using a scratch disk or moving data within the same device every day has a defensible reason to pay for sustained-write capability; paying again for the interface only makes sense when the buyer’s own workflow can use Gen5 bandwidth.
Three buyers, three decisions today
You need the capacity within 90 days: buy. Count the M.2 slots on the motherboard first, then choose a capacity likely to last three to five years. A 2TB QLC drive is serviceable for ordinary gaming. If TLC is only NT$900 more and the workload rewrites a lot of data, choose TLC. Do not translate “upstream volume is allocated” into “buy today or drives disappear forever.”
You have enough space for another year: waiting is reasonable, but track one consistent set of signals. Each quarter, record TrendForce’s NAND supply balance and client-SSD contract-price direction, then log the orderable price of the same exact retail model at the same store. A shrinking supply gap, more client allocation and several consecutive weeks of falling like-for-like prices would indicate retail easing. One promotion does not make a trend.
You have lots of rarely accessed data: tier it. Keep the OS and live working set on a 1TB or 2TB SSD, put cold data on a CMR HDD, and maintain an off-site or cloud copy. Consider used U.2 only if the workload genuinely benefits from enterprise endurance and power-loss protection—and only after including adapter, power, airflow, SMART inspection and return risk in the price.
Finally, read this alongside our DDR5 price analysis. HBM competes more directly with conventional DRAM for wafer area and packaging. NAND feels the effect mainly through company-level investment choices and enterprise-SSD demand. Both are called memory, but they do not justify the same shortage story or the same buying decision.
Research and price snapshot: 12 August 2026. Retail prices change; this article is neither a product guarantee nor investment advice.
Primary sources and research: Phison official 3Q25 investor-meeting video (7 Nov 2025), Phison June-results statement reproduced by TechNews (8 Jul 2026), Phison 2025 annual report (PDF), TrendForce 2Q26 NAND contract-price outlook (31 Mar 2026), TrendForce 2027 NAND balance outlook (21 Jul 2026), TrendForce 2026 memory capex outlook (13 Nov 2025), Micron fiscal Q3 2026 prepared remarks (24 Jun 2026, PDF), Micron Singapore NAND fab groundbreaking (27 Jan 2026), Kioxia/Sandisk Kitakami Fab2 production start (3 Jul 2026), YMTC Ti600 QLC specifications, YMTC TiPlus7100s TLC specifications, Samsung 983 DCT 1.9TB specifications, WD Red Plus data sheet (PDF), ComputerBase Forspoken and file-copy testing (11 May 2023), Central Bank of the Republic of China TWD/USD closing rate.