When TSMC reported second-quarter results on July 16, 2026, it did something it had not done in any prior quarter: it listed 2-nanometer in the revenue-by-technology table.
That is worth pausing on, because one quarter earlier the node was not there at all. The April 16 release broke out 3nm at 25%, 5nm at 36% and 7nm at 13% of wafer revenue — 2nm did not appear as a line item. Three months later it was 3%.
The same earnings call carried two other signals. Chairman and CEO C.C. Wei raised the full-year outlook, saying the company now expects 2026 revenue growth to be “slightly above 40% year over year in US dollar terms.” And CFO Wendell Huang guided third-quarter gross margin down 1.7 percentage points at the midpoint, because the steep ramp of 2nm is expected to dilute gross margin by about 3 to 4 percentage points.
Read together those three facts look contradictory: the most advanced node finally starts selling, the year gets better, and margins go down. Most coverage compresses this into “2nm drags on margins” and stops there. The more useful takeaway is a framework you can reuse every time a foundry brings up a node: the profit curve of a leading-edge process is J-shaped, an early ramp compressing margin is the norm — and the story people reach for first, that the process is in trouble and yield blew up, is precisely the one TSMC’s own statements contradict.
Pin the numbers down first
Everything below comes from TSMC’s own releases and call transcripts, not from secondary coverage.
Second-quarter consolidated revenue was NT$1,270.38 billion (US$40.20 billion), up 36.0% year over year and 12.0% sequentially. Net income was NT$706.56 billion and diluted EPS NT$27.25, both up 77.4% year over year. Gross margin was 67.7%, up 1.5 points from 66.2% in Q1; operating margin 60.3%, net margin 55.6%.
By technology: 2nm 3%, 3nm 30%, 5nm 33%, 7nm 11%. Everything at 7nm and below made up 77% of wafer revenue, against 74% the prior quarter. HPC grew 20% sequentially to 66% of total revenue.
Third-quarter guidance: revenue of US$44.6-45.8 billion, up 12% sequentially and 37% year over year at the midpoint; at an assumed rate of US$1 to NT$32, gross margin of 65% to 67% and operating margin of 56% to 58%.
Two figures from this call get conflated constantly, so separate them now:
- The “3 to 4 percentage points” is the 2nm ramp’s effect on second-half gross margin. Huang’s wording was explicitly “in the second half of the year” — not the full year.
- The “2% to 3%” is overseas fab dilution, an estimate for the early stages of the next several years, widening to 3% to 4% in the later stages. It has nothing to do with 2nm.
Every dilution figure in this article refers to the first unless stated otherwise.
Why a hot node compresses margin
First, what the company itself attributes it to
This section has to separate two things: what TSMC has said, and what this article adds to make it comprehensible.
The one time TSMC gave an explicit reason for new-node dilution was in January 2024, about N3: the node was expected to dilute full-year 2024 margin by 3 to 4 points “as the revenue contribution will be much higher than in 2023.” The attribution lands on a rising share of revenue — not on depreciation. For the second quarter of 2026 the company said only that the steep 2nm ramp is expected to dilute margin by about 3 to 4 points, without breaking it down further.
In fact, the word “depreciation” does not appear anywhere in the 2Q26 or 3Q25 transcripts’ discussion of dilution. Nor is it among the six factors TSMC lists as determining profitability: leadership technology development and ramp-up, pricing, cost reduction, capacity utilisation, technology mix, and foreign exchange. The one that maps to N2 is the first.
So to be explicit about what follows: the depreciation timing gap is this article’s proposed mechanism for why N2’s current-period margin would sit below a mature node’s. It is backed by the accounting notes and the cash flow statement, but TSMC has never attributed dilution to depreciation. Keep the two apart.
1. Depreciation: a five-year schedule against a multi-year revenue ramp
The policy itself is in black and white: TSMC’s accounting notes state that machinery and equipment is depreciated straight-line over five years (buildings over 10 to 20 years).
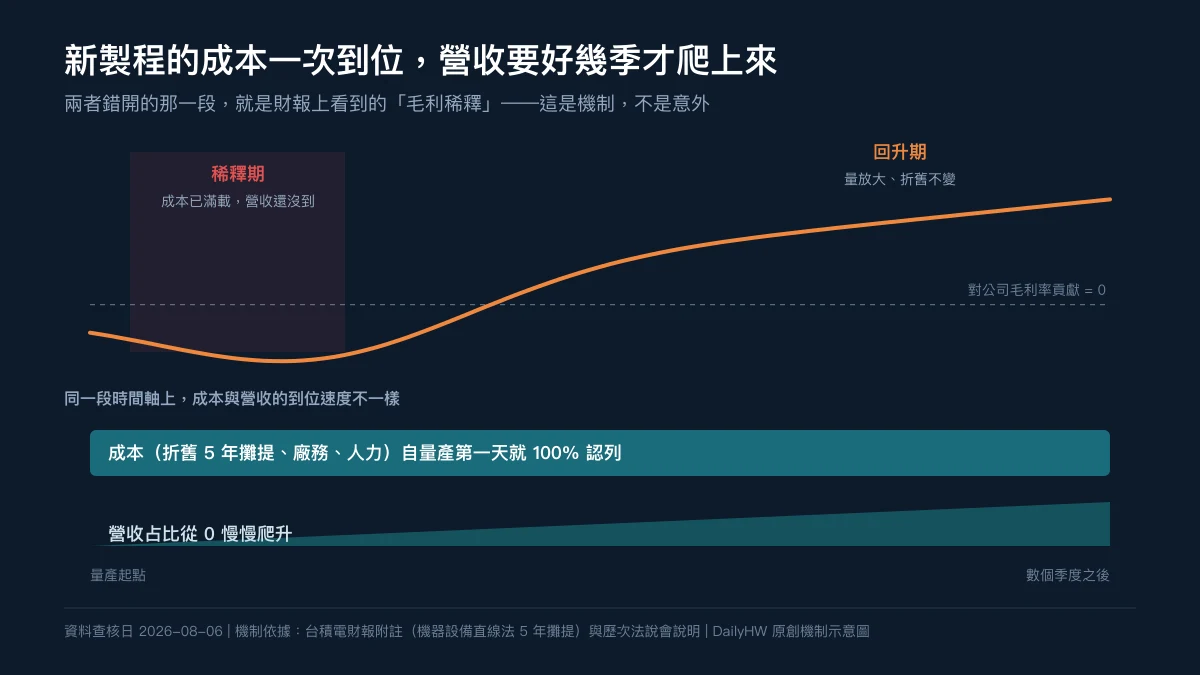
So the moment a 2nm tool is accepted, it starts generating a fixed monthly charge for five years regardless of how many wafers cross it, what the yield is, or what the customer pays. Revenue does not work that way. A new node typically needs several quarters to climb into double-digit revenue share. The cost recognised each period is at full scale from the first period; revenue arrives as a ramp. That offset is one known mechanism behind ramp-phase dilution — one mechanism, not the whole of it. The 3 to 4 points are the net effect of several factors, and TSMC has never published how much belongs to which.
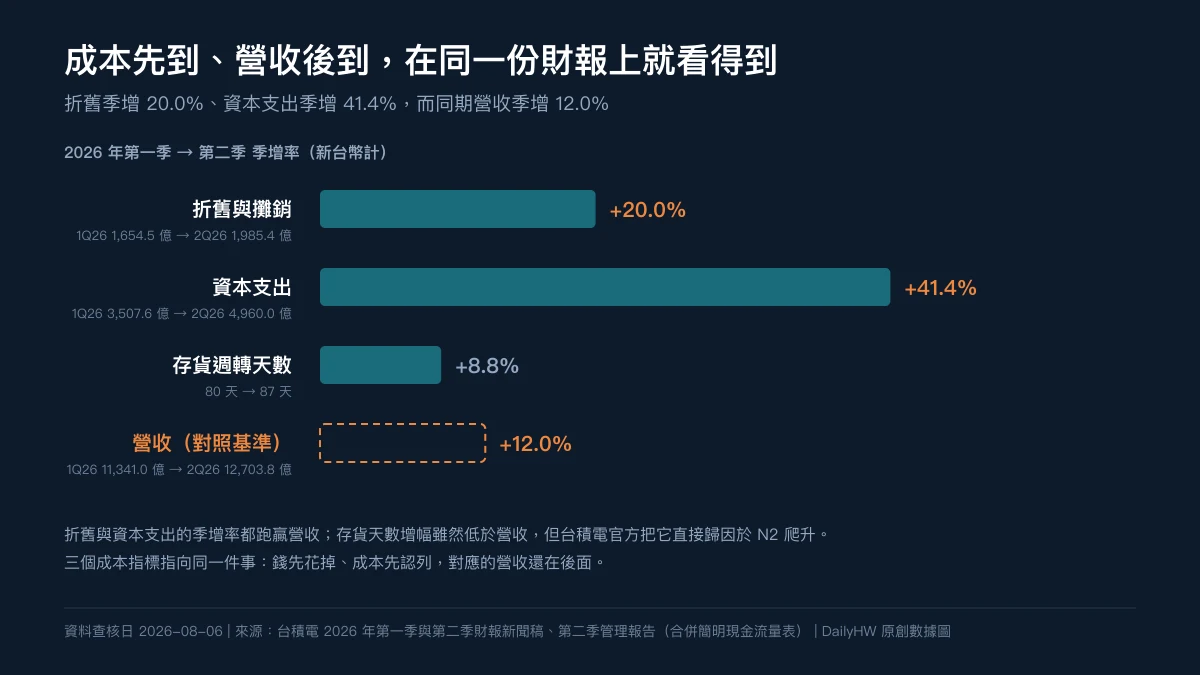
That is not an abstraction — it is visible in this quarter’s cash flow statement. Depreciation and amortization was NT$198.54 billion in Q2 against NT$165.45 billion in Q1, a 20.0% increase in a single quarter, while revenue grew 12.0%.
One qualification has to follow immediately, or the inference runs past the evidence: depreciation outrunning revenue is downward pressure, not a guarantee that margin falls. In fact margin rose this quarter — up 1.5 points sequentially to 67.7% — which TSMC attributed to cost improvement efforts and a slightly higher utilisation rate, partly offset by overseas fab dilution. And the depreciation and amortization figure is not itself current-period cost of revenue: it is a non-cash add-back in the cash flow statement, part of it classified in operating expenses (below the gross margin line) and the manufacturing portion first capitalised into inventory, entering cost of revenue only on shipment. The pair that does bear directly on margin is this: revenue up 12.0% sequentially against cost of revenue up 7.1% — costs grew slower than revenue, so margin rose. Among the six factors TSMC lists there are also capacity utilisation, cost reduction, technology mix, pricing and foreign exchange, several of which moved the other way this quarter and outweighed the depreciation pressure.
That is the single most useful lesson here: “diluted by N points” and “margin actually fell by N points” are different numbers. The cleanest example is in the Q3 guidance itself — N2 is expected to dilute by 3 to 4 points, yet the guided midpoint falls only 1.7 points, because the company simultaneously expects very strong leading-edge demand and continued cost improvement (including productivity gains and across-node capacity optimisation) to offset part of it. Dilution is one force in the mix, not the net result.
Capital expenditure was NT$496.00 billion (US$15.7 billion) in Q2 versus NT$350.76 billion in Q1. Whatever portion of that spending is capitalised converts into depreciation over each asset’s own useful life — five years for machinery and equipment, 10 to 20 for buildings, not a single schedule, and not every dollar of capex ends up as depreciation at all. TSMC has raised its 2026 capital budget to US$60-64 billion, with 70-80% going to advanced process technologies. Directionally the depreciation base will keep stepping up over the next few years; by how much and on what timing depends on the asset mix and acceptance dates, which the company does not publish.
2. Inventory: visible proof of the ramp, but not an explanation of margin
On inventory, TSMC attributed exactly one thing: days rose seven to 87, “primarily due to the ramp of N2 technology.” That clause, and no more.
(The inventory balance over the same period went from NT$311.45 billion to NT$385.53 billion. The company offered no attribution for that movement, and the filings do not break the balance into raw materials, work in progress and finished goods, so this article does not tie it to N2 — it is recorded only as a coexisting fact.)
Be careful not to count this as a second dilution mechanism. Rising inventory does not depress current-period margin — wafers that have not shipped keep their cost in inventory, outside cost of revenue. If anything the direction is to push recognition later, not earlier.
Its value is different: it is the one operational figure TSMC explicitly tied to N2 this quarter, useful for confirming that the ramp has left a mark in the statements. A thermometer for the ramp, not a cause of the margin move.
How the weighted average actually works (the step most often got wrong)
First, something usually assumed rather than checked: TSMC does not publish wafer pricing by node, so how much N2 sells for relative to N3 is not verifiable from outside, and this article does not assume it.
What the company has said is this. Asked in October 2025 about the scale of 2nm dilution, CFO Wendell Huang answered: “N2’s structure profitability is better than N3.” That sharpens the question rather than answering it — if the unit economics are better, why does the blended margin still fall?
Answering it means writing the weighted average correctly — which happens to be the attribution TSMC itself used. As noted above, when the company explained N3 dilution in 2024, the reason it gave was that “the revenue contribution will be much higher than in 2023.” That sentence is about weight.
Company margin is each node’s margin weighted by its share of revenue:
company margin = (1 − w) × margin of everything else + w × N2 margin
where w is N2’s revenue weight.
Three things fall straight out of that.
First, if N2’s margin equals everything else’s, it does not move company margin at all — at any weight. Dilution only arises when N2’s current-period margin sits below the comparison base, and its size is weight × margin gap. A revenue share on its own implies no dilution whatsoever.
Second, why would a line with good yield and better structural profitability post a lower current margin? That is exactly what the depreciation section explains: the full depreciation, facilities and headcount of an entire 2nm line are spread across output that is still small, so unit cost sits above a mature node running at scale. “Structural profitability” describes the long-run economics of the line once mature; “current margin” describes what it looks like today — both can be true at once, and TSMC’s own statements say exactly that.
Third, the official 3% cannot simply be dropped in as w, for two separate reasons.
One is period: the 3% is a second-quarter figure while the 3 to 4 points are a second-half estimate, and the company’s own word for the ramp is “steep.” The other is denominator: TSMC’s 3% is a share of wafer revenue, whereas the 67.7% margin and those 3 to 4 points are both consolidated company figures — total revenue also includes advanced packaging, mask making, testing and more. The w in the formula has to share a denominator with the margin, and TSMC does not publish that number.
Which means the formula’s real use is not to produce an answer but to show you what you are missing. Reversing it for any single figure would require three inputs: N2’s average share of total company revenue in the second half, N2’s current-period margin, and the margin structure of everything else. None of the three is public, so the equation is unsolvable from outside — every “N2’s margin must be around X” or “second-half share will reach Y” is supplying assumptions, not reading a filing.
That itself is a durable habit worth taking away: when a share and a percentage-point figure appear in the same sentence, first ask whether they cover the same period and the same denominator. Nearly every trap in this story is one of those two.
There is also a pricing constraint people underrate. Asked about wafer pricing strategy on the Q2 2026 call, Wei said the higher the margin the better, of course, but that TSMC is a partner and does not want to squeeze customers out of their markets; the company will not suddenly raise prices fourfold or fivefold, but earns its value and keeps profit sufficient to fund long-term expansion. He added, jokingly, that he envies memory makers’ 86% gross margin.
That quote discloses no price level and says nothing about how pricing gets set. The only thing it supports is a posture: the company does not intend to cover this dilution with a large price increase. The actual pace and size of any adjustment is not published, and this article does not guess at it.
So what about yield?
The instinct is to read “a new node dilutes margin” as “yield is in trouble.” That version is the one TSMC’s own statements contradict.
On the October 2025 call the company said N2 was on track for volume production “with good yield,” and on the same call the CFO said N2’s structural profitability is better than N3’s.
That supports one step, not two. “Good yield” is good relative to expectations for this stage of a ramp. It does not mean N2 has caught up with mature nodes, and it certainly does not mean yield contributes nothing to ramp cost. How far N2’s yield sits from a mature node, and what that costs, is not something the company publishes or an outsider can find — TSMC has never decomposed those 3 to 4 points into “so much depreciation, so much yield, so much utilisation.” The company lists six factors and gives a single combined figure.
So only three statements hold:
- there is no evidence for the “N2 yield blew up” story; it does not square with the company’s own statements;
- but there is also no evidence that removes yield from the ramp cost stack;
- the offset between depreciation and the revenue ramp is this article’s inferred mechanism, resting on TSMC’s published depreciation policy and this quarter’s cash flow statement; the company has not attributed dilution to depreciation — the word does not appear anywhere in the Q2 2026 call, and what the 2024 round said was that depreciation would rise close to 30% because of the N3 ramp, which runs the other way. What share belongs to which factor is not recoverable from outside.
The distinction still changes how you read next quarter: treating this as a process failure and treating it as an investment period with a precedent and a known duration lead to opposite conclusions.
The counterexample: N3 was flagged with the same 3 to 4 points two and a half years ago
The best way to judge whether this dilution is a problem is to look at the last time it happened.
On the fourth-quarter call of January 18, 2024, Huang said almost exactly the same thing: Q4 2023 gross margin fell 130 basis points sequentially to 53.0%, primarily on dilution from the continued 3nm ramp, and N3 was expected to dilute gross margin by about 3 to 4 percentage points for the full year of 2024. He also guided 2024 depreciation up close to 30% year over year, mainly on the 3nm ramp. The company’s long-term margin language at the time was “53% and higher is achievable.”
Two and a half years later, 3nm is 30% of wafer revenue and the company posted a 67.7% quarterly gross margin.
First, a subtraction that is easy to get wrong
Seeing “dilutes gross margin by 3 to 4 percentage points,” the instinct is to subtract it from the reported number: 67.7% − 3.5% ≈ 64.2%. That subtraction is wrong, and it is wrong conceptually rather than arithmetically.
Dilution measures the gap against a counterfactual — what margin would have been without the ramp. Nobody publishes that number and it cannot be reconstructed from public data. It is not a decline measured from last quarter’s reported margin. By the same logic, the 53.0% printed for Q4 2023 was already a post-dilution result (on that call the CFO said the 130-basis-point sequential drop was primarily the N3 ramp), so subtracting another 3 to 4 points from it double-counts.
The two moments can therefore only be compared using like for like. TSMC has published two such sets:
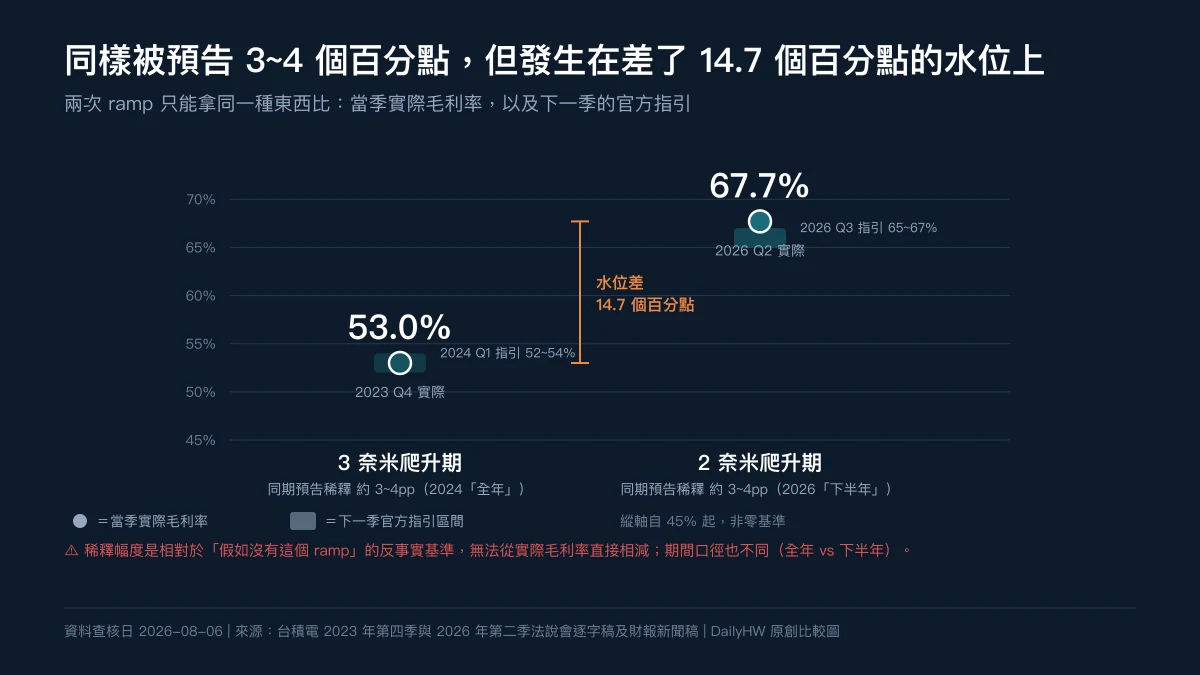
- The N3 round: reported margin 53.0% (2023 Q4); next-quarter guidance 52%-54% (2024 Q1, 53% midpoint); ramp dilution flagged at about 3-4 points — and the same call gave two scopes for it, “full-year 2024” in the prepared remarks and, in the Q&A, “the second half impact from N3 dilution will be between 3 to 4 percentage points.”
- The N2 round: reported margin 67.7% (2026 Q2); next-quarter guidance 65%-67% (2026 Q3, 66% midpoint); ramp dilution flagged at about 3-4 points for the second half of 2026.
The same flagged magnitude, occurring at margin levels 14.7 points apart. Losing one point from a 53.0% level is a 1.9% relative reduction in margin; losing the same point from 67.7% is a 1.5% relative reduction. The same headline number carries different relative weight at each level. That is the form in which this comparison holds.
One thing worth clearing up, because it is easy to get wrong: dilution points are not a quantity poured out over time, so there is nothing to be gained by dividing “3-4 points across a year” by “half a year” and talking about density. Gross margin is itself a period ratio; “diluted by 3 to 4 points” describes how far that period’s margin sits below the counterfactual, and annual and half-year statements each stand on their own without converting into each other. The N3 round carrying both a full-year and a second-half version of the same 3-4 points is precisely the demonstration.
The comparison’s real limitation lies elsewhere: the two quarters sit at different points of their ramps. By Q4 2023 N3 was already 15% of wafer revenue with dilution well underway; N2 was 3% in Q2 2026, with the company explicitly placing the heavy dilution in the second half. So 53.0% is a mid-ramp level and 67.7% is closer to a start-of-ramp level. That does distort the comparison, and it belongs in the open rather than in a footnote.
Huang also made a point in October 2025 worth carrying forward: the old habit of asking how many quarters a new node needs to reach the corporate average has lost much of its meaning, because the corporate average itself keeps moving up. Chasing a moving benchmark produces a moving answer.
Planned dilution versus deteriorating profitability
Both look identical on the income statement — gross margin goes down — and they mean opposite things. Three questions separate them.
First: was the decline announced in advance or explained afterwards? Planned dilution appears in guidance, is quantified as a range, and is scoped to a period. Deteriorating profitability shows up as a miss against the company’s own guidance and gets explained on the following call. Here, the 3-to-4 points came from the CFO while giving guidance.
Second: is the revenue outlook moving the same way? Margin guidance went down while the full-year growth outlook went up past 40%, capex was raised to US$60-64 billion, and the dividend went from NT$18 per share in 2025 to NT$24 in 2026. Demand problems do not look like that.
Third: has the previous node’s dilution narrowed the way the company said it would? This is the closest of the three to a real test — but it is worth being precise about how far it reaches.
In October 2025 Huang said N3 dilution was gradually coming down and that N3 was expected to reach the corporate average sometime in 2026. Today’s facts: N3 delivered 30% of wafer revenue this quarter, and company margin hit a recent high.
That is consistent with “N3 is no longer a drag,” but it is not proof. TSMC never publishes margin by node, so whether N3 actually reached the corporate average cannot be verified from outside, and the company has not updated the statement since. What can be said is narrower: the earlier public claim has not been contradicted, and the direction of the aggregate numbers is consistent with it. That is the “consistent” tier, not the “demonstrated” tier — though absent per-node data it is the hardest signal an outside reader can get.
Conversely: if dilution ever overshoots its own guidance, the revenue outlook is cut at the same time, and the previous node’s dilution refuses to converge, then all three conditions point at genuine deterioration.
Taiwan angle: Fab 20, Fab 22 and thirteen more
For Taiwan, 2nm is not an abstract industry story. It has addresses.
TSMC’s official 2nm technology page states plainly that Fab 20 and Fab 22 are the 2nm production facilities. On the October 2025 call, Wei said the company was preparing multiple phases of 2nm fabs in both the Hsinchu and Kaohsiung Science Parks with the support of the Taiwan government. On the Q2 2026 call he added that TSMC is building 13 leading-edge and advanced packaging fabs in Taiwan over the next several years and will continue to invest there.
Connect those to the capital budget and the local consequence becomes concrete. Of the US$60-64 billion planned for 2026, 70-80% goes to advanced process and roughly 10-20% to advanced packaging, testing and mask making. Building fabs and installing tools lands on facility engineering, cleanrooms, electrical and mechanical work, specialty piping and tool install; once a line is running there is also a continuing stream of gases, chemicals and outsourced facility operations. None of it makes headlines, and all of it books revenue in Taiwan.
Part of it is mechanically linked: the capitalised portion of that spending — buildings and tools — starts depreciating once accepted, which presses on margin. But that line covers only part of the list: gases, chemicals and outsourced facility operations are largely period costs or consumables and never become depreciation. So the orders Taiwanese suppliers book and the rising depreciation line in the filings overlap only in the capitalised segment, not across the whole spend.
But the claim stops there. TSMC does not disclose how capex splits between Taiwan and overseas, and publishes no supplier list, so it is not possible to say how much of those 3 to 4 points is paid to Taiwanese firms — the paragraph above is a directional inference from the budget, the stated allocation and the fab count, not a quantified order forecast. It is also worth remembering that dilution is not the same thing as depreciation: depreciation is one cost spread over each asset class’s own useful life (five years for machinery, 10 to 20 for buildings, land not depreciated at all), not the ramp’s spending recognised at once — while dilution is the combined result of several factors.
Some of that 2nm output is already in real products. AMD announced in May 2026 that its sixth-generation EPYC, codenamed Venice, had entered production ramp on TSMC’s 2nm process in Taiwan — a thread I pulled on in the AM5 upgrade cost analysis. It remains one of the few officially confirmed high-performance products running on N2.
When consumers meet 2nm, and what it does to prices
TSMC never names customers, so any claim about which phone ships 2nm first is inference. But two official statements sketch the outline: N2 entered volume production in Q4 2025 as planned, and the company expects a faster ramp in 2026 driven by both smartphone and HPC/AI applications.
Smartphones being one of the two stated drivers, with volume production more than half a year old, the reasonable inference is that the flagship cycles from late 2026 into the first half of 2027 are where 2nm shows up in consumer devices at scale. That is an inference from official statements, not a schedule TSMC has published.
As for pricing, the intuitive model is wrong. Wafer cost does not pass through proportionally, because the SoC is one line in a bill of materials and retail pricing also absorbs brand strategy, channel, currency and marketing. More to the point, by Wei’s own description of pricing philosophy, the company will not suddenly raise prices fourfold or fivefold. The realistic expectation is that leading-edge cost pressure shows up as slower spec upgrades at a given price point, or a slow upward creep in flagship price bands — not as one generation suddenly jumping.
On the technology itself, TSMC’s April 2023 symposium release put numbers on N2: relative to N3E, up to 15% speed improvement at the same power, or up to 30% power reduction at the same speed, with greater than 1.15x chip density. Three qualifiers travel with those figures: “up to” rather than “about,” the baseline is N3E rather than N3, and the claim dates from two years before volume production. N2 uses TSMC’s first-generation nanosheet transistors; the N2P extension is scheduled for volume production in the second half of 2026.
Four numbers I will be watching
1. Next quarter’s 2nm revenue share. It is in the first paragraph of every quarterly release; no analyst report required. The slope from 3% upward determines how long the bottom of the J-curve lasts. The comparison is already on the record: N3 was 6% of wafer revenue for full-year 2023, 15% in Q4 2023, 23% in Q3 2025 and 30% this quarter — a climb that runs from 2023 through to the second quarter of 2026.
2. Where Q3 actually lands inside the 65-67% guided range, and whether Q4 guidance stabilises. But that range comes with a condition — it rests on an assumed rate of US$1 to NT$32, and the landing point moves with the currency. It has happened before: in Q3 2025 actual margin came in 200 basis points above the top of the guided range, which the company attributed mainly to an actual rate of NT$29.91 against a guidance assumption of NT$29. Check the currency before reading the landing point, or what you are measuring is FX rather than the process.
3. The sequential growth rate of depreciation and amortization. It was 20.0% this quarter. When that starts flattening, the cost step from the latest wave of capacity has run its course. Whether it leads the margin recovery is not something public data can verify — it is on this list because it is one of the few cost-side numbers visible every quarter without waiting for someone else’s interpretation. It sits on the second line of the cash flow statement in the management report and never makes a headline.
4. The exchange rate. In October 2025 Huang offered a conversion he himself called “a rough idea”: every 1% move in the US dollar against the NT dollar affects gross margin by roughly 40 basis points. Q3 guidance assumes US$1 to NT$32. Subtract the currency component before reading anything into a margin move, or you will mistake FX noise for a verdict on 2nm.
Back to the apparent contradiction. “2nm heats up and margin gets diluted” sounds like a node that fails to make money, yet every official statement points the other way: good yield, structural profitability better than N3, and a raised full-year outlook.
The defensible reading is narrower. The only mechanical attribution TSMC has offered for new-node dilution came in January 2024, about N3: “the revenue contribution will be much higher than in 2023” — the weight term in the weighted average. For N2 this time the company said only “steep ramp-up,” without breaking it down. And a weight can only dilute if the new node’s current-period margin sits below the mature ones. Fixed costs recognised at full scale while revenue is still climbing is this article’s explanation for that precondition, supported by the depreciation policy and the cash flow statement — but TSMC has not attributed dilution to depreciation, and that line has to hold.
How much of those 3 to 4 points belongs to which factor is not something the company has broken out, and it is not recoverable from outside; all that can be said is that the figure is an estimate of several factors combined.
So the number to track was never how many points came off this quarter — it is whether the curve turns back up on schedule, the way the last one did.
Data verified 2026-08-06. All financial figures are taken from TSMC’s own filings, not from secondary coverage. Sources: TSMC second quarter 2026 earnings release (2026-07-16; 2nm at 3% of wafer revenue, 67.7% gross margin), TSMC 2Q26 earnings conference transcript (3-4 point 2H dilution, full-year outlook above 40%, US$60-64bn capital budget, 13 fabs in Taiwan), TSMC 2Q26 management report (depreciation and capex cash flow detail), TSMC first quarter 2026 earnings release (2026-04-16; no 2nm line item, 66.2% gross margin), TSMC 4Q23 earnings conference transcript (2024-01-18; N3 diluting full-year 2024 margin by 3-4 points, 53.0% gross margin, depreciation up close to 30%), TSMC 3Q25 earnings conference transcript (N2 good yield, structural profitability better than N3, Hsinchu and Kaohsiung 2nm phases, 40bp margin sensitivity per 1% FX move), TSMC 3Q23 earnings conference transcript (lists the six factors determining profitability: leadership technology development and ramp-up, pricing, cost reduction, capacity utilisation, technology mix and foreign exchange), TSMC official 2nm technology page (4Q25 volume production, first-generation nanosheet, Fab 20 and Fab 22 as the 2nm facilities, N2P in 2H26), TSMC 2023 Technology Symposium release (2023-04-27; N2 up to 15% speed, up to 30% power, greater than 1.15x density versus N3E), TSMC 2023Q4 financial statement notes (machinery and equipment straight-line over 5 years, buildings 10 to 20 years).