On the July 29, 2026 earnings call, Satya Nadella described how much data center Microsoft had built that quarter. He did not count racks, servers, or GPUs. He said the company “added another gigawatt of capacity this quarter” and remained on track to roughly double total capacity in two years.
A gigawatt is a unit of electricity. When a software company starts measuring its buildings the way a utility measures power plants, that is worth noticing.
Around the same time, a claim started circulating: the big four cloud providers will spend roughly US$725 billion in 2026, and more than 60% of it goes to power infrastructure, cooling and data center construction rather than to compute hardware. It fits the intuition that AI’s bottleneck has moved from GPUs to the grid.
I pulled the filings, the SEC exhibits and the earnings call transcripts for all four companies and checked them line by line. That 60% is backwards. The conclusion that power is the binding constraint survives — but not for the reason the claim gives.
The four numbers, from primary sources
Alphabet (calendar year). Q2 2026 purchases of property and equipment: US$44.924 billion, against US$22.446 billion a year earlier; US$80.598 billion for the first half. On July 22, CFO Anat Ashkenazi raised full-year guidance to US$195–205 billion, up from US$180–190 billion.
Amazon (calendar year). Gross purchases of property and equipment for the twelve months to June 30: US$173.028 billion. On the July 30 call, Andy Jassy said: “We now believe we will spend approximately $220 billion in cash CapEx in 2026. The higher cost of memory pushing this number up from our prior estimate of about $200 billion.” That memory squeeze is the same one covered from the other end in our DDR5 price analysis.
The sentence he added next is the one worth keeping: “Even at that amount, we will still not have enough capacity to meet all the demand we have in 2026, and I believe this dynamic will also be true in 2027, too.” Budget went to US$220 billion and capacity still falls short — which is itself a hint that the thing blocking him is not the budget.
Meta (calendar year). Q2 capex including principal payments on finance leases: US$31.1 billion. Full-year guidance US$130–145 billion, narrowed upward from US$125–145 billion.
Microsoft (fiscal year ending June 30, 2026). Cash capex for the full fiscal year: US$115.948 billion, against US$64.551 billion the year before.
Notice that the last one covers a different twelve months than the other three.
No company’s disclosure supports the 60%-on-power claim
This is the correction that matters. Every company that broke out its capex composition points the other way.
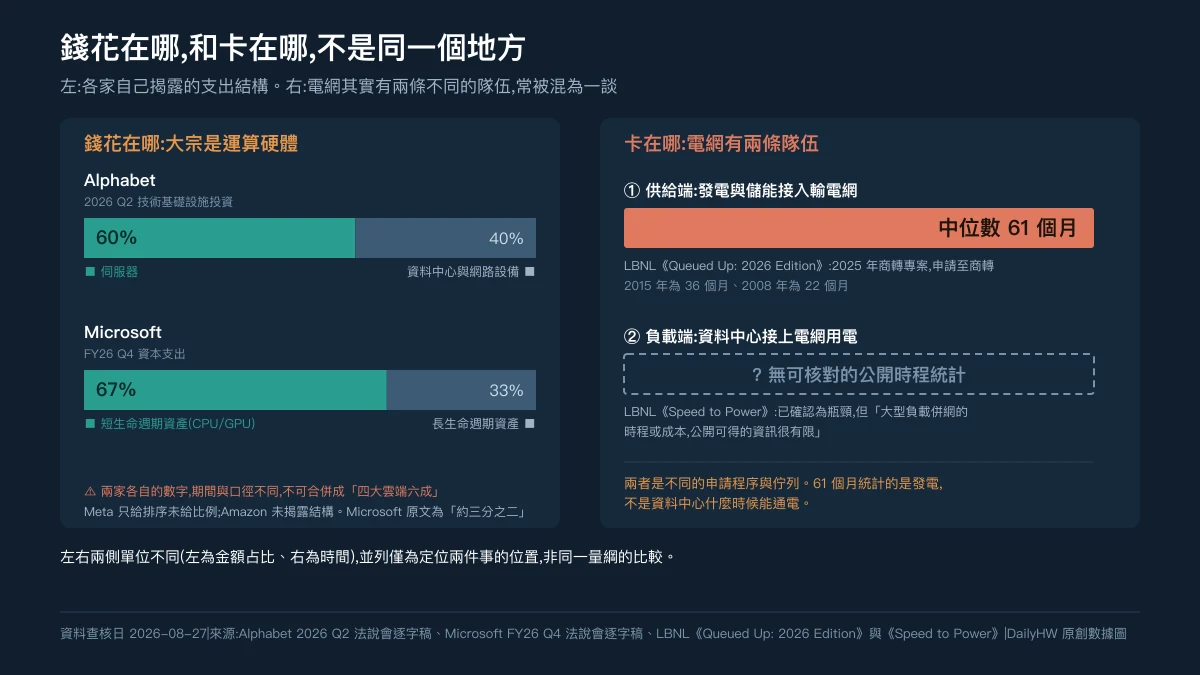
Alphabet was explicit: “Approximately 60% of our investment in technical infrastructure this quarter was in servers, and 40% was in data centers and networking equipment.”
Microsoft CFO Amy Hood: “Roughly two thirds of our capex was for short-lived assets, primarily CPUs and GPUs.” The remainder went to long-lived assets.
Meta described the quarter’s spending as “driven by investments in servers, data centers, and network infrastructure” — servers first.
All three put compute at the top. The claim that over 60% goes to power rather than compute has no counterpart in any company’s disclosure.
Three qualifiers, so this does not get overstated in the other direction: Alphabet’s 60% and Microsoft’s two-thirds are two separate figures on different periods and definitions, and cannot be merged into a single “the big four spend 60% on servers”; Meta gave an ordering, not a percentage; Amazon disclosed no composition at all. And Alphabet’s 40% bucket is “data centers and networking equipment”, which already mixes in switches and optics — it cannot be read as power and cooling.
If you see that 60% figure used as evidence, it has no primary source behind it. This article does not use it.
So why is power still the bottleneck?
Because a bottleneck is not determined by its share of spending. It is determined by whether money and time can convert into it. Air is 0% of an aircraft’s cost and still decides where the aircraft can fly.
Meta’s CFO made the logic explicit when asked about planning for 2028:
When we think about planning today for ’28, we’re really focusing on flexibility. That’s just giving us kind of the ability to have land and power. But to really make the actual decisions about buying chips and other big-ticket items further in the future.
In plain terms: lock in land and power now; decide on chips later. Not because power costs more, but because the grid side runs on a different clock — and it is not one queue, it is two.
Two things that keep getting conflated
Connecting to the grid comes in two entirely different forms:
- Supply side — a new power plant or storage facility connecting to the transmission grid to push electricity out.
- Load side — a data center, as a large electricity customer, connecting to draw electricity in.
They run through different processes, sit in different queues, and are counted separately. The 61 months below belongs to the first, not the second — a distinction that matters, because it is routinely borrowed as proof that “data centers wait five years for power.”
Supply side: the median for new generation is now 61 months
Lawrence Berkeley National Laboratory’s Queued Up: 2026 Edition, published June 2026 with data through the end of 2025:
- About 2,061 GW of generation and storage was actively seeking interconnection (1,312 GW generation, 749 GW storage), across 8,244 active requests.
- The median project reaching commercial operation in 2025 spent 61 months from interconnection request to operation — against 36 months in 2015 and 22 months in 2008.
- Of requests submitted between 2000 and 2020, only about 19% of projects (13% of capacity) had reached commercial operation by the end of 2025.
- The 2,061 GW in queues exceeds the entire installed capacity of the US power plant fleet, 1,374 GW.
The report’s methodology is blunt about scope: the data “only include resources that supply electricity to the transmission grid (i.e., generation and storage); there are separate queues for large loads and those are not included in this report.” Its title is, after all, Characteristics of Power Plants Seeking Transmission Interconnection.
So 61 months answers “where will the electricity come from, and how long until it arrives” — not “when does the data center get energised.”
Two further limits. LBNL’s own slide notes the report “is not an assessment of resource adequacy”, and the duration statistic covers only the 73% of operational projects with a valid in-service date. Separately, more than 750 GW withdrew from queues in 2025 against roughly 600 GW of new requests — the second consecutive year of net outflow. The queue is getting slower and shorter at the same time.
Load side: the public data barely exists
So how long does a data center itself wait to get connected? The honest answer: there is no matching public number.
LBNL published a second report the same month — Speed to Power: Solutions for Accelerating Large Load Connections, funded by the US Department of Energy’s Office of Electricity — dealing specifically with large load connections. It opens:
Rapid growth in demand from data centers and other large loads is creating a range of new challenges for electricity planners, investors, system operators, and regulators, leading to bottlenecks that have slowed connection of large loads to the electric grid.
The report catalogues 41 potential solutions for accelerating those connections. It also notes this:
There is limited publicly available information on large load interconnection timelines or costs.
That sentence is worth keeping: the load-side jam is confirmed by a national laboratory, but how long it actually lasts has no externally auditable statistic. So this article gives no wait time for the load side — not because it does not matter, but because there is no verifiable figure, and inventing one would be writing a guess as a fact.
What, then, is the 61 months’ relationship to data centers? Indirect but real: the electricity a data center consumes has to be generated by someone, and the clock on new generation runs in years; the load side then has its own queue, whose length is simply not visible from outside. Stack the two and Meta’s logic becomes obvious — tie down land and power well before 2028, and leave the chip decision until later. As Amy Hood put it, CPUs and GPUs have “relatively shorter lead times.”
The same wall shows up inside the rack
The constraint is not only at the grid. NVIDIA’s May 2025 technical blog explains why data center power distribution has to move from 54 VDC to 800 VDC: past roughly 200 kW per rack, the conventional approach starts hitting physical limits. The article is specific:
- Running 54 VDC in a single 1 MW rack would require up to 200 kg of copper busbar.
- At megawatt scale, power shelves would consume as much as 64 U of rack space — leaving nowhere to put the compute.
- 800 VDC improves end-to-end efficiency by up to 5%, cuts copper use by 45%, and lowers total cost of ownership by up to 30%.
NVIDIA says the architecture targets 1 MW IT racks, starting in 2027.
So the complete statement is: most of the money buys chips, but whether those chips can be energised is decided by a different supply chain, a different regulatory process, and a different order of time. Being able to afford it is not the same as being able to plug it in.
Why you should not add the four numbers together
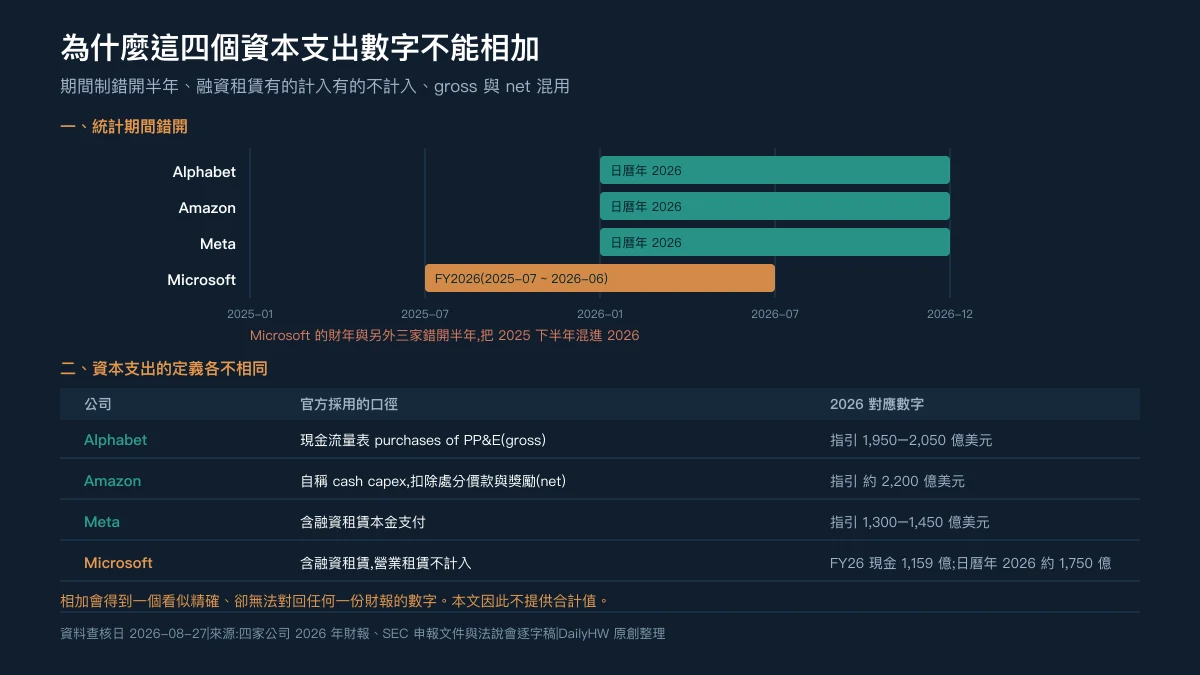
The circulating US$725 billion is a sum of four incompatible figures. At least three things do not line up.
Periods are offset. Microsoft’s FY2026 runs July 2025 to June 2026. Adding it to three calendar-2026 figures folds half of 2025 into 2026.
Finance leases count for some and not others. Amy Hood said it directly: “Finance leases are included in capital expenditures while operating leases are not.” Microsoft’s US$41 billion quarter was US$35.8 billion of cash paid for property and equipment plus US$5.6 billion of finance leases. Meta’s guidance explicitly includes finance lease principal. Alphabet’s figure comes straight off the cash flow statement.
Gross and net are mixed. Amazon’s CFO put Q2 cash capex at US$53.1 billion, while the 8-K cash flow statement shows US$54.208 billion — Amazon’s house measure is net of proceeds from sales and incentives. On a trailing-twelve-month basis the two are US$169.007 billion (net) and US$173.028 billion (gross), a US$4.021 billion gap.
Microsoft supplied a calendar-2026 reference point and, in the same breath, demonstrated how definitions move the number. From FY27 the company is extending the estimated useful lives of datacenters and office buildings from 15 to 25 years, which shifts more future datacenter leases from finance to operating leases. Excluding that effect, Hood said calendar-2026 investment expectations are unchanged — but the finance-to-operating shift “adjusts our expectation to approximately $175 billion.”
Same year, same buildings, different accounting classification, different headline capex. This article therefore publishes no combined total — publishing one would manufacture a precise-looking figure that reconciles to nothing.
The downside case, stated honestly
Rising capex is not validated demand. Three signals are worth watching.
Free cash flow has already turned negative. Alphabet’s Q2 free cash flow was negative US$5.9 billion. Amazon’s trailing-twelve-month free cash flow was negative US$7.604 billion, against positive US$1.232 billion a year earlier. Alphabet’s CFO said free cash flow “will remain under pressure.”
Depreciation assumptions are adjustable. Microsoft’s extension from 15 to 25 years is justified as reflecting “our operating history and expected use of these assets”, and the company says it “affects only the timing of future depreciation”, with minimal benefit to FY27 operating income. The explanation is reasonable. It also demonstrates something: when the same assets can be depreciated over 15 years or 25, depreciation expense is not a purely physical quantity. Check whether the denominator changed before reading anything into future margins.
And if demand disappoints? Hood answered that directly:
You’ve seen our CapEx really pivot toward what I would call and do call short-lived assets, which really, that’s CPUs and GPUs that have relatively shorter lead times. And so, if the demand environment changes, you just slow down what is, in fact, the largest component and the driver of COGS.
That cuts both ways. The good news is the money is concentrated in assets you can stop buying on short notice, rather than in concrete that completes in five years. The bad news is that the same short life means those assets depreciate quickly — the cost reaches the income statement fast, and hitting the brakes does not undo it.
Where Taiwan sits in this chain
Taiwan’s position is not on the grid. It is in getting power into the rack — and NVIDIA’s own documentation locates it. In the October 2025 800 VDC ecosystem list, Delta and LITEON are named under “power system components”, alongside Bizlink, Flex, Lead Wealth and Megmeet; a separate category, “data center power systems”, lists ABB, Eaton, Schneider Electric, Vertiv and others.
What that list establishes is their position and category in the chain — not market share or supply volume. NVIDIA discloses no per-company share, and this article does not speculate about one.
From the Taiwan Stock Exchange’s official monthly revenue filings (data month July 2026, published August 17, 2026):
- Delta Electronics (2308), electronic components: July revenue NT$67.073 billion, against NT$45.397 billion a year earlier — up 47.75% year over year. January–July cumulative NT$409.682 billion, up 42.08%.
- Lite-On Technology (2301), computer peripherals: July revenue NT$19.006 billion, up 37.61% year over year. January–July cumulative NT$115.118 billion, up 26.99%.
An honest caveat, and a more conservative one than most coverage offers: these are company-wide monthly revenues, not data center power revenues. Delta also builds EV powertrain, industrial automation and building automation products; Lite-On spans several lines. Monthly filings do not break out product segments, so “up 47.75%” cannot be read as “AI power products grew 47.75%” — how much of it comes from data centers is a question the public data cannot answer.
What it supports is one sentence: two Taiwanese companies named on NVIDIA’s 800 VDC power-component list are growing company-wide monthly revenue at roughly 40% year over year. How much of that growth is the AI power-architecture transition will only be answerable when the companies disclose segment figures themselves. This article does not answer it for them.
As for Taiwan as a site for data centers, the scale can be checked against official data. Taipower’s open data feed of real-time generation by unit (checked August 27, 2026, 13:50) shows 214 units with 60.70 GW of total installed capacity, generating 38.62 GW net at that moment (gas 15.09 GW, coal 7.27 GW, solar 6.38 GW, IPP gas 5.91 GW).
Put Nadella’s “another gigawatt this quarter” on that scale: 1 GW is about 1.6% of Taiwan’s total installed capacity, or about 2.6% of net generation at that moment.
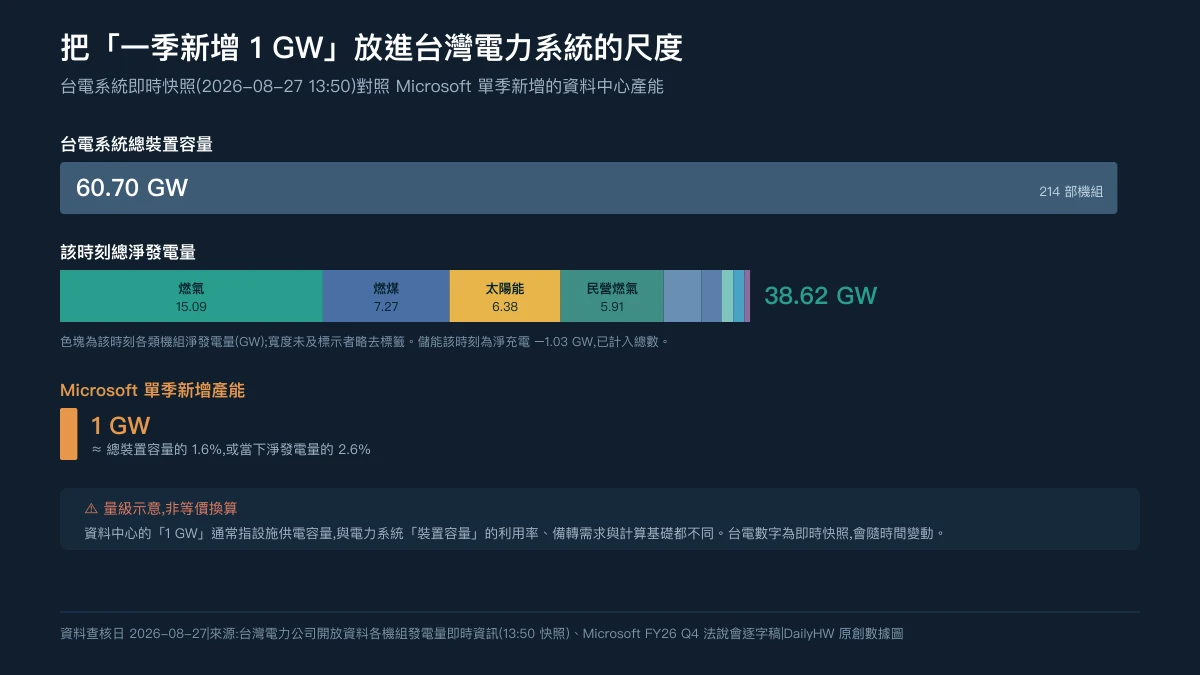
That comparison needs a caveat: a data center’s “1 GW” usually refers to facility power capacity, which differs from grid installed capacity in utilisation, reserve requirements and basis of calculation, so this is an order-of-magnitude illustration, not a conversion. Even read loosely, the point holds: one cloud provider’s quarterly addition is not a rounding error against Taiwan’s power system. That is why electricity supply outranks land and labour in siting decisions for large AI data centers.
Three things I will be watching
One: watch the definition, not just the number. Microsoft’s lease reclassification from FY27 will move some spending out of the capex line. The next time a company’s capex growth appears to slow, check whether investment actually slowed or the accounting moved. The test is simple — see whether the company still discloses finance lease amounts, and whether the basis matches the prior period.
Two: the slope of Taiwanese power suppliers’ monthly revenue growth. Delta and Lite-On file the prior month’s revenue before the 10th, and the exchange’s open data endpoint serves it directly — two to three months ahead of quarterly reports. Note what it is: recognised revenue, not backlog, and not forward visibility. It tells you about shipments that already happened, not demand that has not. Watch for an inflection in the year-over-year rate rather than whether a single month set a record. For the AI contribution specifically, wait for segment disclosure.
Three: the supply-side median, and when load-side data starts being published. LBNL updates Queued Up annually (the 2026 edition landed in June). If the 61-month median starts falling, the constraint on new generation is loosening. But the more valuable thing to wait for is the other one: Speed to Power has already flagged that large load interconnection timelines are not publicly documented. Once a grid operator or regulator begins publishing load-side timeline statistics, there will finally be a number that answers “how long does a data center wait.” Until then, any claim that data centers wait N months for power deserves one question first: does your source count generation, or consumption?
Back to the contradiction at the top. The “60% goes to power” claim spread quickly because it paired a correct intuition with a wrong number.
The correct intuition: electricity is now the variable that sets how fast AI capacity can expand. That is supported by Meta’s CFO saying land and power get locked first while chip decisions wait, by Nadella measuring capacity in gigawatts, by Jassy saying US$220 billion still will not buy enough capacity, by LBNL confirming that large load connections have become a bottleneck, and by NVIDIA rebuilding an entire power architecture to serve a 1 MW rack.
The wrong number is the 60%. The bulk of the money still goes to compute hardware, and the companies that disclose composition all say so.
There is one more lesson worth carrying, and it is one I nearly walked into while reporting this: “the grid is jammed” has two versions — generation and consumption — and they are separate queues. The widely quoted 61 months is the generation one; LBNL states in the report that load interconnection is excluded. How jammed the consumption side is, a national laboratory says the public information does not tell you. So when you next see “data centers wait N months for power,” ask first: does that N count generation, or consumption?
That both can be true at once is the framework worth keeping: in any supply chain, the stage that takes the most money and the stage that sets your pace are frequently not the same stage. Read capex coverage by asking “where is it spent?” and “where is it stuck?” as two separate questions, and you will misread a lot less of it.
Data verified 2026-08-27. All financial figures are quoted from company filings, SEC exhibits and earnings call transcripts; no aggregate from secondary media is used. Sources: Alphabet Q2 2026 earnings release (Q2 purchases of property and equipment US$44.924B; H1 US$80.598B), Alphabet Q2 2026 earnings call transcript (2026-07-22; ~60% servers, 40% data centers and networking; FY guidance raised to US$195–205B; Q2 free cash flow negative US$5.9B), Microsoft FY2026 Q4 Form 8-K (FY2026 additions to property and equipment US$115.948B), Microsoft FY2026 Q4 earnings call transcript (roughly two thirds of capex in CPUs and GPUs; finance leases included in capex while operating leases are not; useful lives extended from 15 to 25 years; calendar 2026 adjusted to ~US$175B; one gigawatt added in the quarter), Amazon Q2 2026 Form 8-K (TTM purchases of property and equipment US$173.028B gross, US$169.007B net; TTM free cash flow negative US$7.604B), Amazon Q2 2026 earnings call transcript (2026-07-30; full-year cash capex raised to approximately US$220B; Q2 US$53.1B), Meta Q2 2026 earnings call transcript (Q2 capex including finance lease principal US$31.1B; FY guidance US$130–145B; land and power prioritised in 2028 planning), LBNL, Queued Up: 2026 Edition (June 2026, data through end-2025. Covers generation and storage projects seeking transmission interconnection; the methodology states load interconnection is excluded: 2,061 GW in queues; 61-month median for 2025 completions; 19% of 2000–2020 requests built), NVIDIA technical blog — 800 VDC architecture (2025-05-20; 200 kg copper busbar for a 1 MW rack, up to 5% efficiency gain, 45% less copper, up to 30% lower TCO, from 2027), LBNL, Speed to Power: Solutions for Accelerating Large Load Connections (June 2026, funded by the US DOE Office of Electricity: bottlenecks have slowed connection of large loads; limited publicly available information on large load interconnection timelines or costs; 41 potential solutions), NVIDIA technical blog — 800 VDC ecosystem partner list (2025-10-13; Delta and LITEON named under power system components), Taiwan Stock Exchange open data — listed company monthly revenue (data month July 2026; Delta and Lite-On revenue and growth rates), Taiwan Power Company open data — real-time generation by unit (snapshot 2026-08-27 13:50; 60.70 GW installed, 38.62 GW net generation).